Testing assumptions about over-fetching from the database
One of my common code review comments is about over-fetching from the database;
e.g. running a SELECT * instead of SELECTing just the columns your
application needs. This is very common when using object-relational mappers
(ORM)s like EntityFramework (EF) or funneling access to your database using
the repository pattern.
Time passes and technology evolves; I find it useful to re-evaluate my assumptions every now and then. Is over-fetching still something to worry about?
This post will run some benchmarks to get a better sense of the impact of over-fetching. I also have been wanting an excuse to learn BenchmarkDotNet, and this seemed like a decent problem.
The problem
Over-fetching occurs when our application reads more data from the database than it needs. Let’s walk through an example to demonstrate how easy it is to introduce over-fetching to a codebase.
Note: this example code is oversimplified and does not represent best practices.
Say we’re using the repository pattern and have this interface:
public interface IRepository
{
  /// <summary>
  /// Fetch a customer from the database
  /// </summary>
  Customer GetCustomer(int id);

  /// <summary>
  /// add a payment for the given customer
  /// </summary>
  Payment SavePayment(decimal amount, int customerId);
}
The IRepository implementation could use EF, it could use Dapper,
ADO.NET, whatever. At this point that detail is irrelevant.
The GetCustomer implementation is ultimately going to run one or more queries
and then map the results into a Customer instance. In the simplest case this
might run a query like
SELECT Name, Address, Email FROM Customers WHERE Id = ?.
Say we have a new feature request to send an email when a customer makes a payment. Our payment code currently looks like this:
void ProcessPayment(decimal amount, int customerId)
{
  // actually charge the customer's card
  this._paymentService.Charge(amount, customerId));
  // update our records
  this._repository.SavePayment(amount, customerId);

  // TODO: send an email
}
At this point, we have a IRepository handy, and it’s very quick to add in
emailing:
void ProcessPayment(decimal amount, int customerId)
{
  // actually charge the customer's card
  this._paymentService.Charge(amount, customerId));
  // update our records
  this._repository.SavePayment(amount, customerId);
  // notify the customer
  var customer = this._repository.GetCustomer(customerId);
  this._emailService.Enqueue(customer.Email, "Payment received!");
}
Re-using the pre-existing IRepository.GetCustomer introduces our over-fetch;
ProcessPayment only needs the Email, but it’s going to get the whole object.
An optimized version would issue a query like
SELECT Email FROM Customers WHERE Id = ?.
This solution has a few downsides:
- moves more data over the network between the database and the application
- increases garbage collection;
IRepository.GetCustomeris allocating memory for data we don’t use, and it’ll get reclaimed afterProcessPaymentexits - any future changes that make
IRepository.GetCustomerslower (e.g. adding more properties toCustomerand fetching more data from the db) will impactProcessPayment
This solution has a few appealing upsides:
- re-uses existing trustworthy code
- quick to implement
- smaller pull/merge request
We could eliminate the over-fetch by adding something like
IRepository.GetCustomerEmail, but that’s going to set a messy precedent that
may lead to a million methods on IRepository. If IRepository is implemented
with EF we could refactor to return IQueryable<Customer> and let the caller
use Select to decide what to fetch, but that’s a bigger change that introduces
it’s own set of pros and cons.
Does this over-fetching really matter? Let’s test it.
spoiler alert: it depends.
Experiment design
We’ll use BenchmarkDotNet to assess performance between SELECTing one
column vs all the columns. We’ll test across a few variables:
- ORM library: Dapper, EFCore, EFCore with no-tracking queries
- Width: how many columns are in the table we’re
SELECTing from, increasing exponentially between 2 and 512
We’ll run a SQL Server in docker, generate a database with EFCore, and then run
our benchmarks. Every table will have an Id, Email, and Name, and our
benchmarks will be fetching Email for a given Id. For the extra database
columns we’ll cycle through some normal types (int, DateTimeOffset, etc) to
generate a vaguely realistic mix. We’ll use AutoFixture to generate some
varied test data.
I’ll run it all on my laptop:
BenchmarkDotNet=v0.12.1, OS=ubuntu 20.04
Intel Core i7-10875H CPU 2.30GHz, 1 CPU, 16 logical and 8 physical cores
.NET Core SDK=3.1.411
  [Host]     : .NET Core 3.1.17 (CoreCLR 4.700.21.31506, CoreFX 4.700.21.31502), X64 RyuJIT
  DefaultJob : .NET Core 3.1.17 (CoreCLR 4.700.21.31506, CoreFX 4.700.21.31502), X64 RyuJIT
The source code is up on github.
In hindsight, I made a couple of mistakes here:
- it would have been a lot simpler to add a
varbinarycolumn and load that with random data of different sizes - I forgot width 8 when making the test db tables, skipping from 4 to 16
Oh well, let’s run it.
Results
The process took about 36m on my laptop, and I got some interesting results.
EFCore
The first test compared straightforward EF usage, effectively these two methods:
string Overfetch()
{
    using var db = new OverFetchingContext();
    return db.Set<Table>()
      .Single(x => x.Id == Id)
      .Email;
}

string SelectOne()
{
    using var db = new OverFetchingContext();
    return db.Set<Table>()
        .Where(x => x.Id == Id)
        .Select(x => x.Email)
        .Single();
}
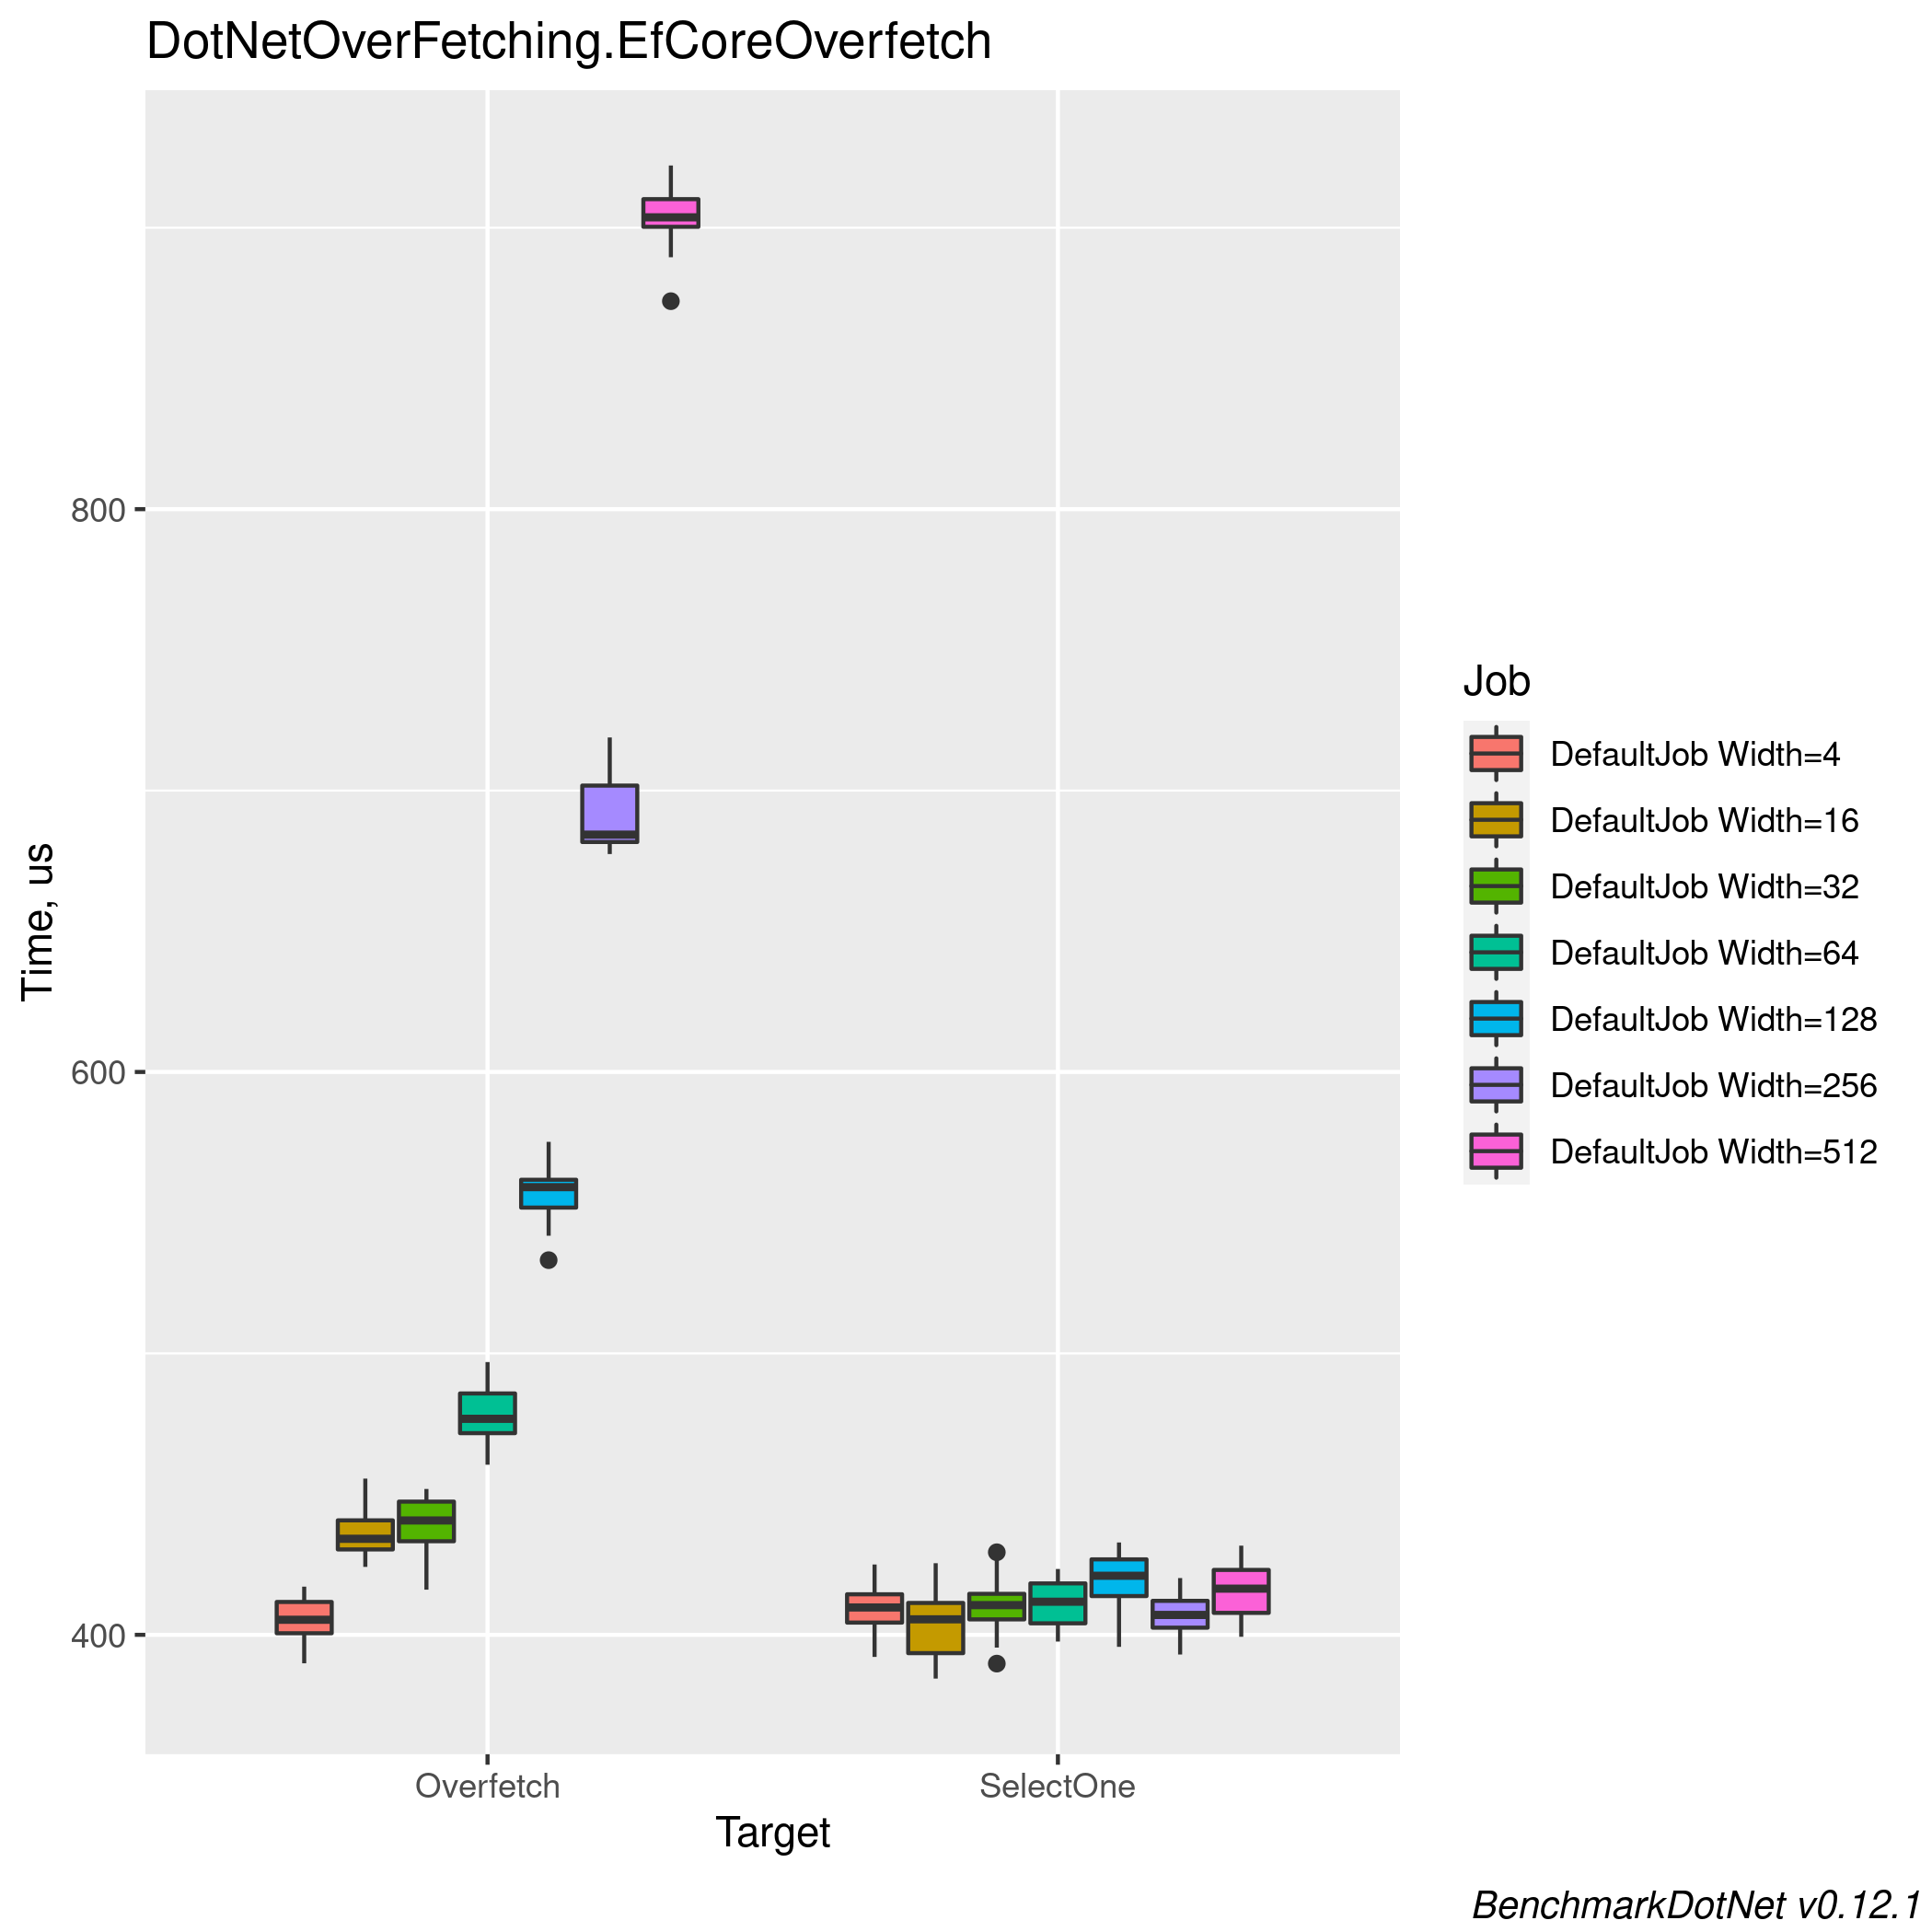
The results are pretty stark; we see a clear exponential increase in duration as we exponentially increase the table size, and selecting a single column gives consistent performance. It looks like for small tables, over-fetching doesn’t matter.

The memory stats tell a similar story; larger tables start allocating more and gets into longer-lived GC generations.
| Method | Width | Mean | Error | StdDev | Gen 0 | Gen 1 | Allocated |
|---|---|---|---|---|---|---|---|
| Overfetch | 4 | 405.6 μs | 8.02 μs | 7.87 μs | 4.8828 | - | 39.88 KB |
| SelectOne | 4 | 408.8 μs | 7.97 μs | 8.52 μs | 4.8828 | - | 40.3 KB |
| Overfetch | 16 | 436.6 μs | 8.68 μs | 8.52 μs | 5.3711 | - | 44.07 KB |
| SelectOne | 16 | 403.5 μs | 7.95 μs | 11.14 μs | 4.8828 | - | 39.85 KB |
| Overfetch | 32 | 439.5 μs | 8.53 μs | 9.82 μs | 5.8594 | - | 49.48 KB |
| SelectOne | 32 | 410.8 μs | 7.88 μs | 9.68 μs | 4.8828 | - | 40.36 KB |
| Overfetch | 64 | 478.4 μs | 8.73 μs | 10.72 μs | 7.3242 | 0.4883 | 60.19 KB |
| SelectOne | 64 | 411.7 μs | 8.09 μs | 7.95 μs | 4.8828 | - | 40.02 KB |
| Overfetch | 128 | 557.5 μs | 10.03 μs | 10.73 μs | 9.7656 | 0.9766 | 81.87 KB |
| SelectOne | 128 | 419.7 μs | 8.12 μs | 9.35 μs | 4.8828 | - | 40.36 KB |
| Overfetch | 256 | 691.9 μs | 13.71 μs | 12.83 μs | 14.6484 | 2.9297 | 126.12 KB |
| SelectOne | 256 | 407.0 μs | 6.68 μs | 7.15 μs | 4.8828 | - | 39.85 KB |
| Overfetch | 512 | 903.9 μs | 12.63 μs | 11.81 μs | 26.3672 | 8.7891 | 215.51 KB |
| SelectOne | 512 | 415.5 μs | 8.03 μs | 9.56 μs | 4.8828 | - | 40.19 KB |
EFCore with AsNoTracking()
The results are pretty similar to the previous benchmark. It looks like
AsNoTracking does not change much for duration nor allocation.
![]()
| Method | Width | Mean | Error | StdDev | Gen 0 | Gen 1 | Allocated |
|---|---|---|---|---|---|---|---|
| Overfetch | 4 | 404.2 μs | 8.00 μs | 9.82 μs | 4.8828 | - | 39.88 KB |
| SelectOne | 4 | 406.5 μs | 7.50 μs | 6.65 μs | 4.8828 | - | 40.3 KB |
| Overfetch | 16 | 422.8 μs | 8.08 μs | 9.61 μs | 5.3711 | - | 44.07 KB |
| SelectOne | 16 | 413.1 μs | 8.11 μs | 7.59 μs | 4.8828 | - | 39.85 KB |
| Overfetch | 32 | 443.7 μs | 4.16 μs | 3.68 μs | 5.8594 | 0.4883 | 49.49 KB |
| SelectOne | 32 | 399.5 μs | 7.95 μs | 10.06 μs | 4.3945 | - | 39.16 KB |
| Overfetch | 64 | 481.1 μs | 8.96 μs | 9.20 μs | 7.3242 | 0.4883 | 60.19 KB |
| SelectOne | 64 | 412.9 μs | 7.78 μs | 7.99 μs | 4.8828 | - | 40.19 KB |
| Overfetch | 128 | 548.6 μs | 10.64 μs | 9.43 μs | 9.7656 | 0.9766 | 81.87 KB |
| SelectOne | 128 | 402.7 μs | 6.82 μs | 7.30 μs | 4.8828 | - | 39.83 KB |
| Overfetch | 256 | 682.5 μs | 13.53 μs | 12.66 μs | 14.6484 | 2.9297 | 126.12 KB |
| SelectOne | 256 | 409.1 μs | 7.92 μs | 11.36 μs | 4.8828 | - | 39.85 KB |
| Overfetch | 512 | 885.5 μs | 14.20 μs | 13.28 μs | 26.3672 | 8.7891 | 215 KB |
| SelectOne | 512 | 405.8 μs | 8.09 μs | 8.99 μs | 4.3945 | - | 39.16 KB |
Dapper
This test compared straightforward Dapper usage, effectively these two methods:
string Overfetch()
{
    using var db = new SqlConnection(Program.ConnectionString);
    return db.QuerySingle<Table>(
        "SELECT * FROM Table WHERE Id = @id", new { Id })
        .Email;
}

string SelectOne()
{
    using var db = new SqlConnection(Program.ConnectionString);
    return db.QuerySingle<string>(
        "SELECT Email FROM Table WHERE Id = @id", new { Id });
}
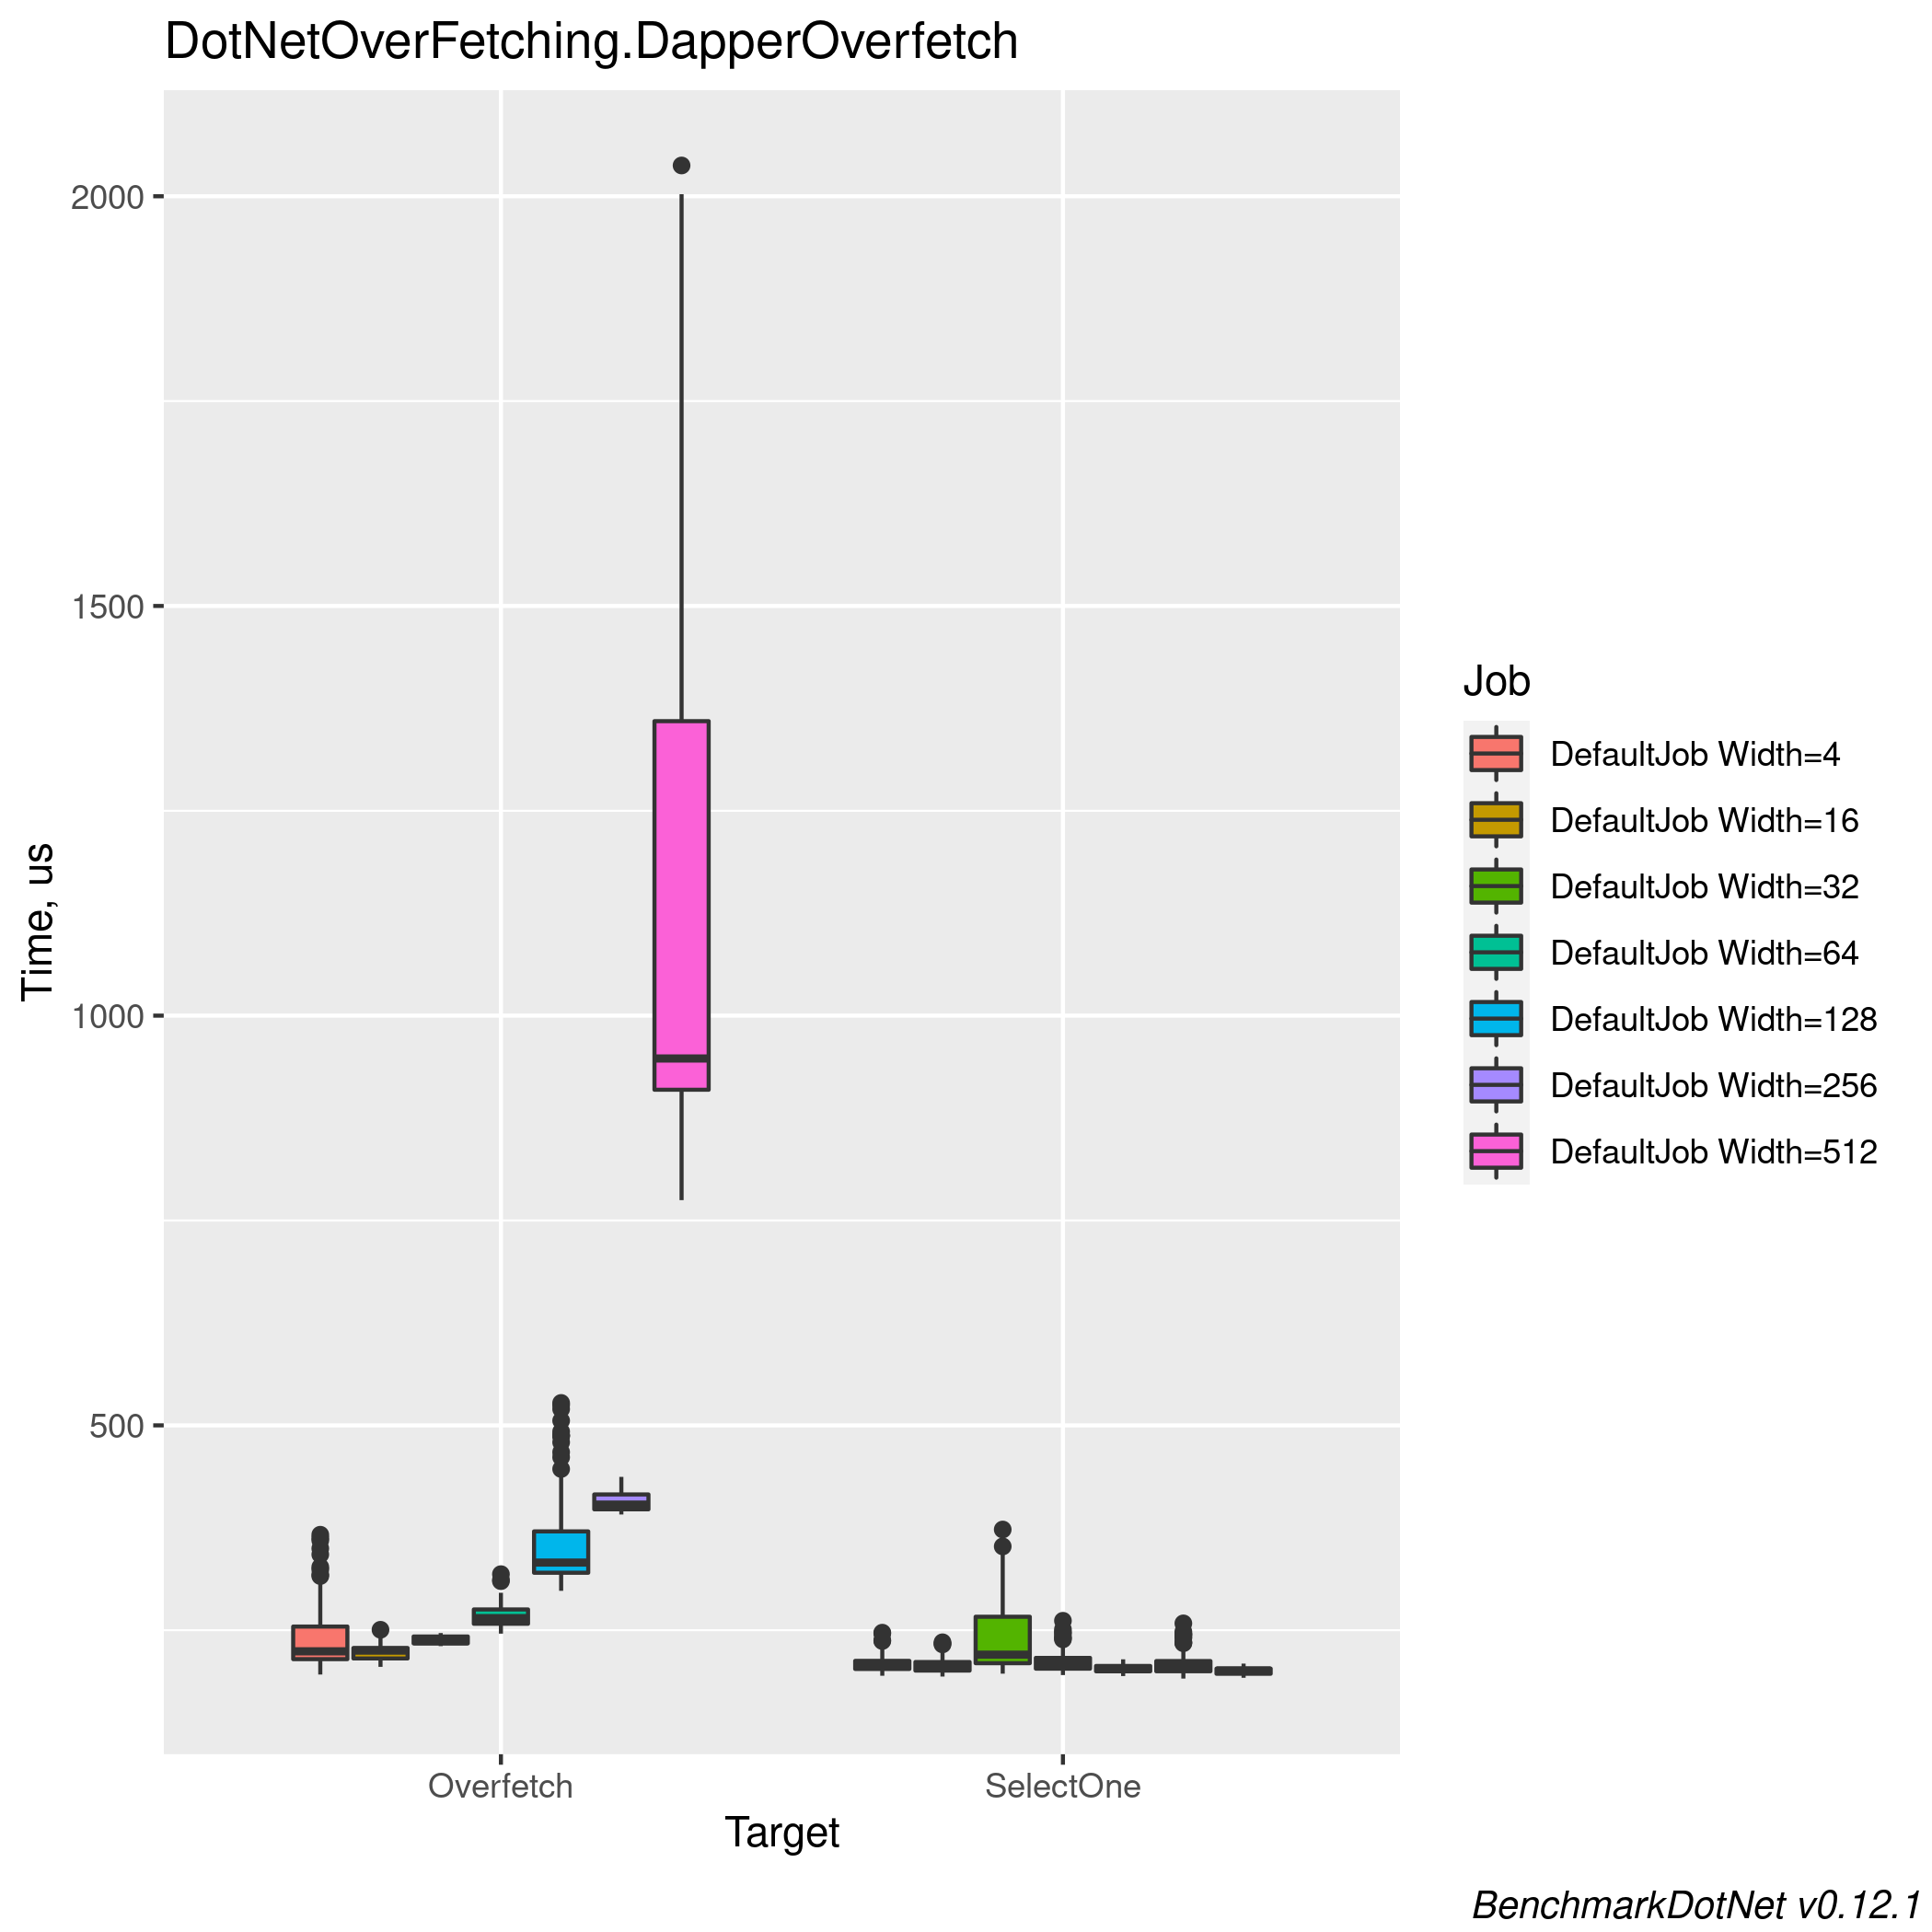
Dapper has similar behavior to EF, with a big shift when we hit the largest table:

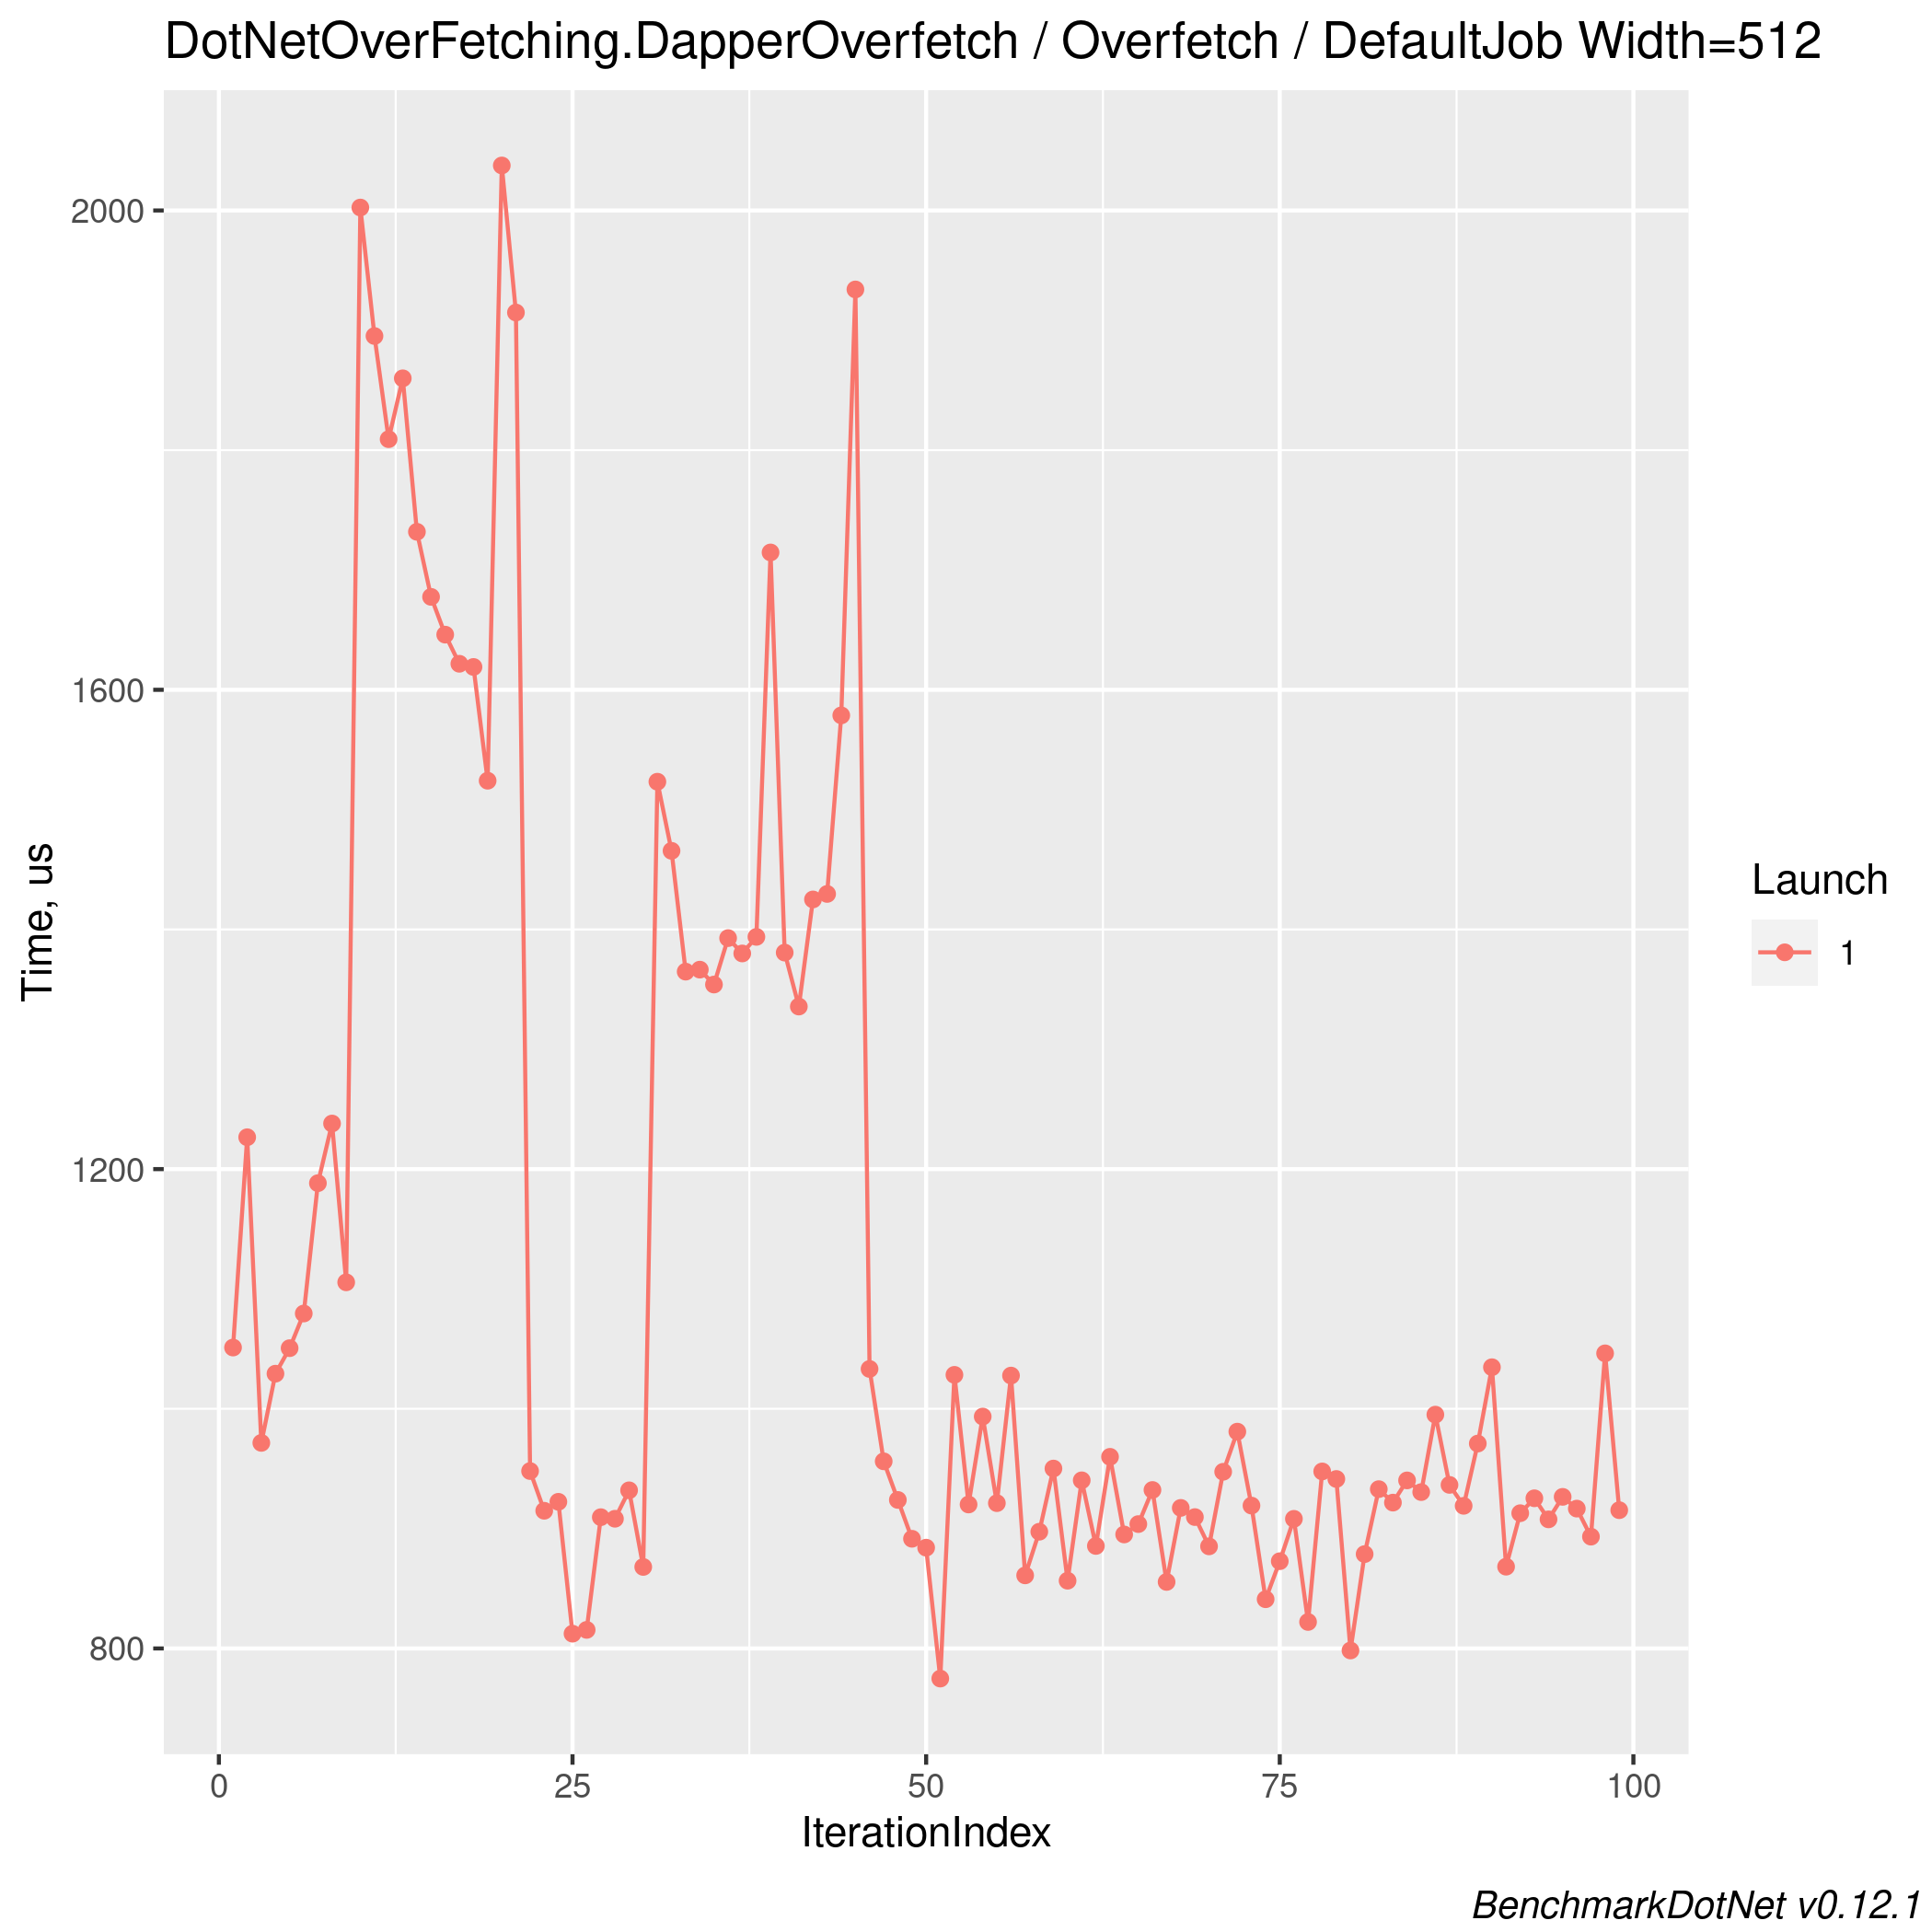
BenchmarkDotNet gives us a lot of data, let’s take a closer look at that last run over-fetching a 512 column table:

Looks like most of the runs were between 800 and 1000 μs, with a few slower clusters early on. Maybe something else was consuming resources on my laptop? This is part of why benchmarking is so difficult; really controlling the environment takes a lot of legwork.
The memory stats align with our assumptions: over-fetching allocates more and more memory.
| Method | Width | Mean | Error | StdDev | Median | Gen 0 | Gen 1 | Allocated |
|---|---|---|---|---|---|---|---|---|
| Overfetch | 4 | 241.3 μs | 14.81 μs | 41.52 μs | 224.2 μs | 0.4883 | - | 5.34 KB |
| SelectOne | 4 | 209.3 μs | 4.16 μs | 10.90 μs | 206.1 μs | 0.2441 | - | 3.5 KB |
| Overfetch | 16 | 224.4 μs | 4.41 μs | 9.49 μs | 225.1 μs | 0.9766 | - | 9.42 KB |
| SelectOne | 16 | 207.4 μs | 4.15 μs | 9.19 μs | 205.7 μs | 0.2441 | - | 3.5 KB |
| Overfetch | 32 | 237.9 μs | 4.57 μs | 4.89 μs | 236.5 μs | 1.4648 | - | 14.65 KB |
| SelectOne | 32 | 240.2 μs | 15.67 μs | 43.43 μs | 220.2 μs | 0.2441 | - | 3.5 KB |
| Overfetch | 64 | 268.3 μs | 5.36 μs | 14.13 μs | 264.8 μs | 2.9297 | - | 25.1 KB |
| SelectOne | 64 | 212.3 μs | 5.00 μs | 13.69 μs | 209.3 μs | 0.2441 | - | 3.5 KB |
| Overfetch | 128 | 358.5 μs | 21.24 μs | 59.91 μs | 332.5 μs | 5.3711 | 0.4883 | 46.27 KB |
| SelectOne | 128 | 203.7 μs | 3.78 μs | 5.54 μs | 203.5 μs | 0.2441 | - | 3.5 KB |
| Overfetch | 256 | 407.0 μs | 7.96 μs | 12.15 μs | 403.3 μs | 10.7422 | 2.4414 | 89.78 KB |
| SelectOne | 256 | 210.0 μs | 5.33 μs | 14.68 μs | 206.5 μs | 0.2441 | - | 3.5 KB |
| Overfetch | 512 | 1,122.3 μs | 111.93 μs | 328.27 μs | 947.7 μs | - | - | 176.58 KB |
| SelectOne | 512 | 200.4 μs | 3.91 μs | 4.80 μs | 200.9 μs | 0.2441 | - | 3.5 KB |
Conclusions
- BenchmarkDotNet is an amazing tool
- selecting specific columns gives you consistent performance
- over-fetching doesn’t seem to be a big deal for small tables, but it does add noticeable time and memory pressure
- possible future work:
- try it with a
varbinarycolumn of various sizes instead of the random column madness - try
net5, there’s a lot of low-level performance work in that runtime - wrap these in a standard web api, deploy to Azure, benchmark a more “production-like” environment using HTTP load testing tools
- try it with a
I could see it easy to accumulate a lot of individually trivial over-fetching and end up with a “death of 1000 cuts” style performance problem. I really like the consistency we see from selecting only what is needed; that gives confidence to make changes to the database access layer without worrying about affects on existing code.
I think I’ll keep making the code review comment, but won’t block the review unless it’s a large table.
